By The Way
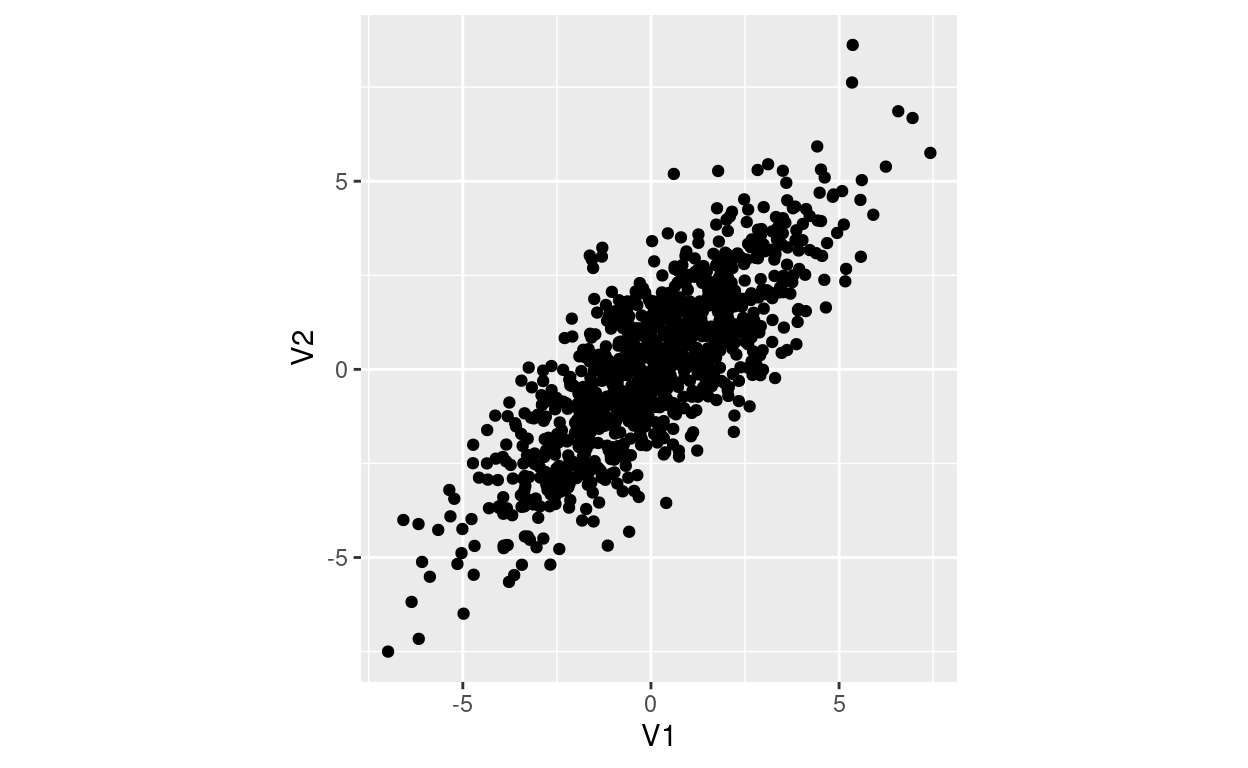
多変量正規分布のHighest Density Regionを調べる
Finding highest density region given a multidimensional normaldistribution.
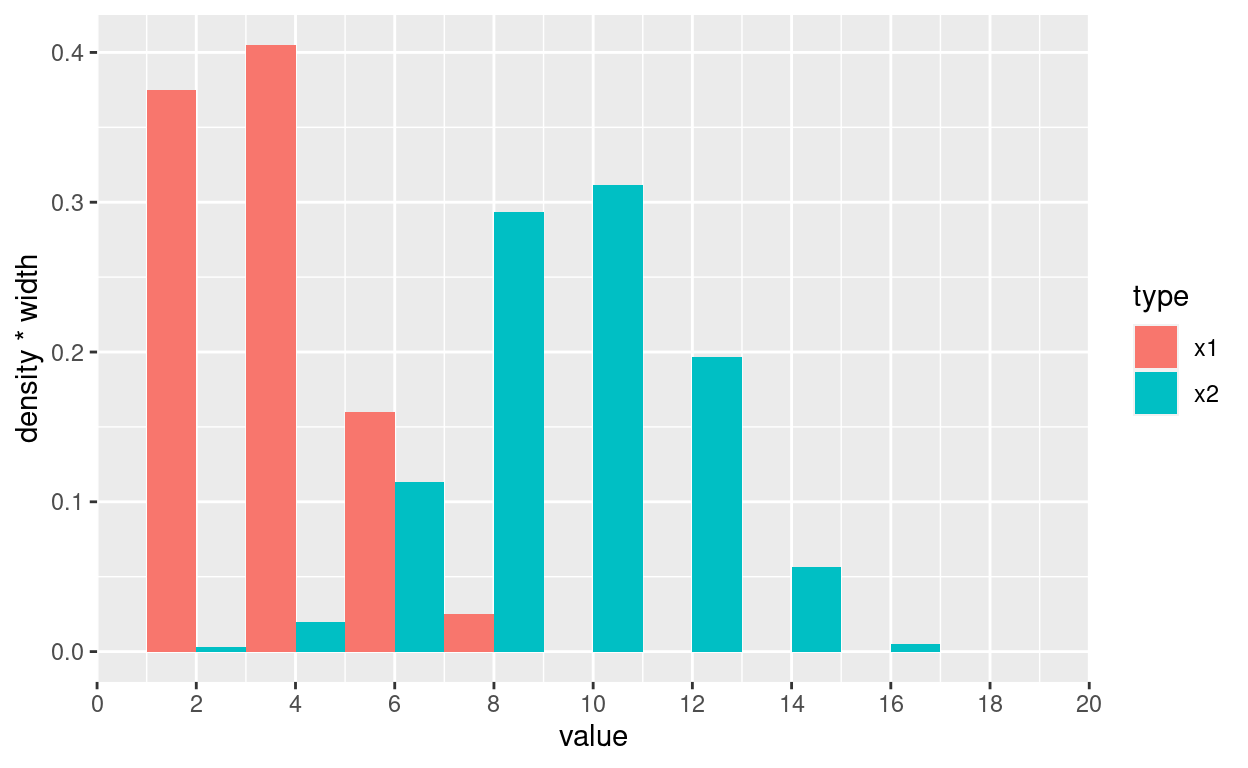
ggplotでグループ毎の頻度ヒストグラムを隣り合わせて作成
group histogram by ggplot
jpndistrictのDocker環境設定
A short description of the post.
多くのファイルを遅延評価で読み込み、メモリ消費を抑える
quosureを用いると計算が必要なときに読み込まれて、メモリ消費を抑えられる。
CmdStanRでGPU(OpenCL)を使う
CmdStanRの導入とOpenCLのメモ
dplyrを使った関数
dplyrを関数で使うためのメモ